Recently I wanted to learn how to use emojis as points in a scatterplot points. It seems like the emojifont package is a popular way to do it. However, I couldn’t seem to get it to work on my machine (perhaps I need to install the font manually?). The other package I found was emoGG; this post shows how to use this package. (For another example involving fire stations, see this script.)
Let’s load the packages:
library(ggplot2)
library(emoGG)
Let’s load a less commonly used small dataset that comes with base R called ToothGrowth:
data("ToothGrowth")
summary(ToothGrowth)
# len        supp         dose
# Min.   : 4.20   OJ:30   Min.   :0.500
# 1st Qu.:13.07   VC:30   1st Qu.:0.500
# Median :19.25           Median :1.000
# Mean   :18.81           Mean   :1.167
# 3rd Qu.:25.27           3rd Qu.:2.000
# Max.   :33.90           Max.   :2.000
Here is the dataset’s description from its documentation:
The response is the length of odontoblasts (cells responsible for tooth growth) in 60 guinea pigs. Each animal received one of three dose levels of vitamin C (0.5, 1, and 2 mg/day) by one of two delivery methods, orange juice or ascorbic acid (a form of vitamin C and coded as
VC).
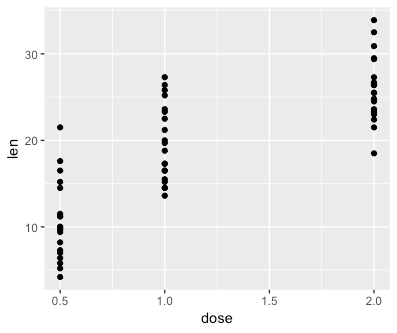
A little esoteric… but it’ll work for our purposes. Let’s make a scatterplot of len vs. dose:
ggplot(data = ToothGrowth) +
    geom_point(aes(dose, len))
To plot emojis instead of points, we use the geom_emoji layer and specify which emoji to use with the emoji option:
ggplot(data = ToothGrowth) +
    geom_emoji(aes(dose, len), emoji = "1f439") +
    labs(x = "Dose (mg/day)", y = "Tooth length")

We can add horizontal jitter to the points manually:
ggplot(data = ToothGrowth) +
    geom_emoji(aes(dose + runif(nrow(ToothGrowth), min = -0.2, max = 0.2),
                   len), emoji = "1f439")  +
    labs(x = "Dose (mg/day)", y = "Tooth length")

I wasn’t able to find an elegant way to have different emojis printed for different points. For example, this dataset contains 30 guinea pigs fed by orange juice and 30 fed by ascorbic acid: we might want different emojis to represent these two groups. The following code does not work:
# doesn't work
ggplot(data = ToothGrowth) +
    geom_emoji(aes(dose + runif(nrow(ToothGrowth), min = -0.2, max = 0.2),
                   len), emoji = supp) +
    labs(x = "Dose (mg/day)", y = "Tooth length")
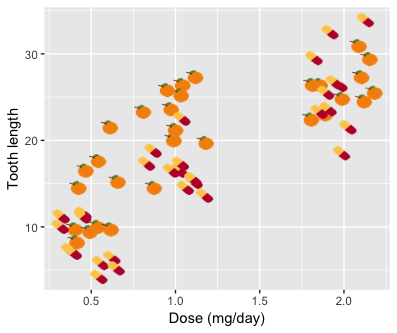
What we could do is add separate layers manually for each of the 30 guinea pigs. It’s cumbersome but it works…
p1 <- geom_emoji(data = subset(ToothGrowth, supp == "OJ"),
                aes(dose + runif(sum(ToothGrowth$supp == "OJ"), min = -0.2, max = 0.2),
                   len), emoji = "1f34a")
p2 <- geom_emoji(data = subset(ToothGrowth, supp == "VC"),
                 aes(dose + runif(sum(ToothGrowth$supp == "OJ"), min = -0.2, max = 0.2),
                     len), emoji = "1f48a")

ggplot() +
    p1 + p2 +
    labs(x = "Dose (mg/day)", y = "Tooth length")
How did I find the emoji code to use? emoGG comes with an emoji_search function that helps us with that. For example, to find the code for the orange emoji:
emoji_search("orange")
# emoji             code     keyword
# 2184 tangerine            1f34a      orange
# 2235    carrot            1f955      orange
# 4092         a            1f170  red-square
# 4093         a            1f170    alphabet
# 4094         a            1f170      letter
# 4130         o             2b55      circle
# 4131         o             2b55       round
# 4364        ng            1f196 blue-square
# 4365        ng            1f196       words
# 4366        ng            1f196       shape
# 4367        ng            1f196        icon
# 5311   georgia 1f1ec\\U0001f1ea          ge

See also this answer on Stackoverflow: https://stackoverflow.com/questions/46803260/assigning-40-shapes-or-more-in-scale-shape-manual/46814238#46814238 and the emojifont package.
LikeLike
Thanks!
LikeLike
Sir can you please make the emojis larger or smaller depending on the value. it will be nice to show increase in yield due to a treatment. Thanks
LikeLike
The geom_emoji layer does have a size option that you can specify, but it looks like it can’t be data dependent… You’re probably better off trying the emojifont package (see other comment in for this post).
Actually, I’d say that if you want the size to reflect some data value, it’s probably best to use regular points instead of emojis; it’ll be easier for the reader to compare observations.
LikeLike
Thanks so much for the advice on how to assign different emojis to different groups! Is there a way to add stat_smooth(lm) lines to an emoGG scatterplot? I’ve been struggling with this and it seems like it should not be so difficult!
LikeLike
This seemed to work for me:
ggplot(data = ToothGrowth) +
geom_smooth(aes(dose, len), method = “lm”, se = FALSE) +
geom_emoji(aes(dose, len), emoji = “1f439”) +
labs(x = “Dose (mg/day)”, y = “Tooth length”)
geom_smooth with method set to lm plots the linear regression line.
LikeLike
Thanks, but I’m still struggling to add geom_smooth lines by group in the figure where I have 3 different emojis to represent the three groups. I receive the following error message a lot —
Error: Cannot add ggproto objects together. Did you forget to add this object to a ggplot object?
LikeLike
This worked for me (adding lines to the last example in my post):
p1 <- geom_emoji(data = subset(ToothGrowth, supp == "OJ"),
aes(dose + runif(sum(ToothGrowth$supp == "OJ"), min = -0.2, max = 0.2),
len), emoji = "1f34a")
p2 <- geom_emoji(data = subset(ToothGrowth, supp == "VC"),
aes(dose + runif(sum(ToothGrowth$supp == "OJ"), min = -0.2, max = 0.2),
len), emoji = "1f48a")
ggplot(data = ToothGrowth) +
geom_smooth(aes(x = dose, y = len, col = supp), method = "lm", se = FALSE) +
p1 + p2 +
labs(x = "Dose (mg/day)", y = "Tooth length")
LikeLike
Thank you so much!
LikeLike
Trying to figure out how to add a legend. So far nothing is working 😦
LikeLike
I’m not sure there’s a way to add a legend quickly, but you can always add one manually using custom annotations (e.g. https://ggplot2.tidyverse.org/reference/annotate.html and https://stackoverflow.com/questions/9917049/inserting-an-image-to-ggplot2)
LikeLike